Whenever you read a news story online, do you ever see an image with data? These images are often called infographics. You can also visualize the data using various infographic styles.
It is necessary not to create infographics carelessly. Infographics need to present accurate and concise data. However, it should be easy to understand by others. Hence, the visuals of the infographic design must also be appealing to the reader.
What is an infographic?
The Oxford dictionary defines infographics as visual representations of information or data. The purpose of an infographic is generally to attract the reader’s attention through pictures, photos, illustrations, icons, and text.
Many readers find it difficult to read long, complicated data texts. Therefore, an infographic design is meant to present this information visually, making it easier for readers to understand the data.
Hence, making infographics is indeed a challenging task. Before making one, you should be aware of several aspects.
What to Consider Inside the Infographic
A good infographic should take into account several factors. You need to take this into account to convey the information accurately. Here are some crucial aspects of an infographic:
1. Write a short but concise text
Firstly, an infographic communicates written information shortly and concisely. So, reduce the use of less effective words. Only write down the critical points of the data you created.
Consider writing only numbers or percentages for a data set and its variables. Alternatively, you can incorporate the rest of the explanation into a supporting graphic or image.
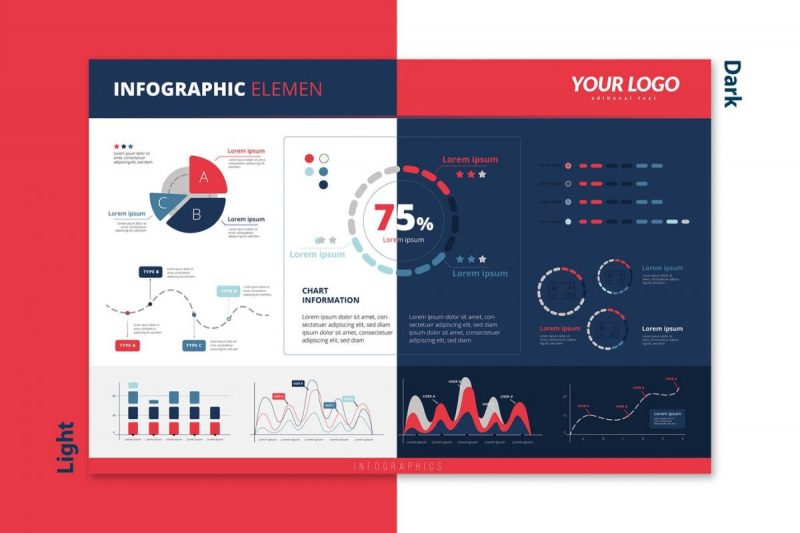
2. Use a chart or graph
Another crucial element is to use appealing images and visuals in an infographic. Usually, infographics use diagrams or charts to show the quantity of data.
3. Harmonious color choice
Third, choose colors that are harmonious and easy to read. Here, harmony refers to the clarity of the background color, the text, and the visuals. Don’t use colors that make the text difficult to read because of similar background colors.
4. Write a brief prologue
The infographic must include more than titles and visuals. Describe the data you want to convey in a short narrative as a prologue. A few sentences are sufficient.
Infographic design options
Knowing the notable aspects of an infographic allows you to use it effectively right away. Still, in general, many people are uncertain about which infographic design to choose.
So, below we’ve included a few infographic design ideas that we hope will inspire you. Check it out!
1. Using a neutral color background
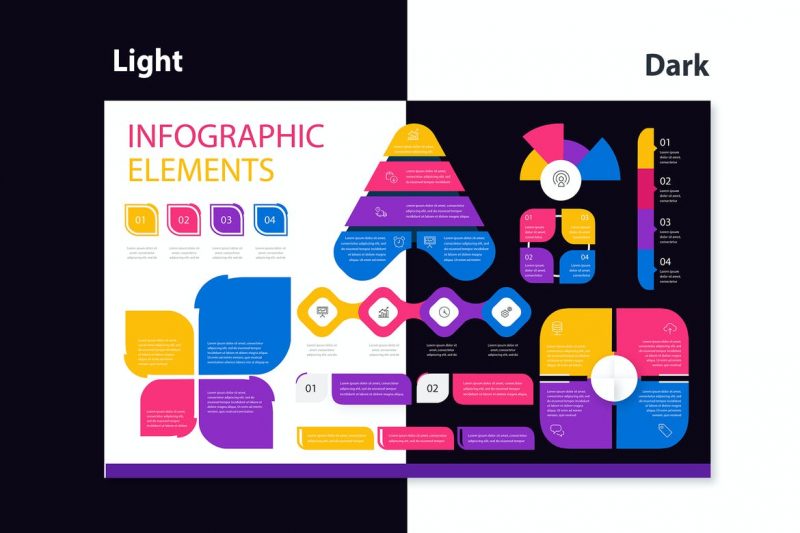
First, use a neutral-colored background for your infographic. The graphics and text in the infographic will stand out more if you use neutral colors like black and white or pastels.
Make sure graphics and text don’t have the same color as the background. Add different colors to the graphics to make them more appealing.
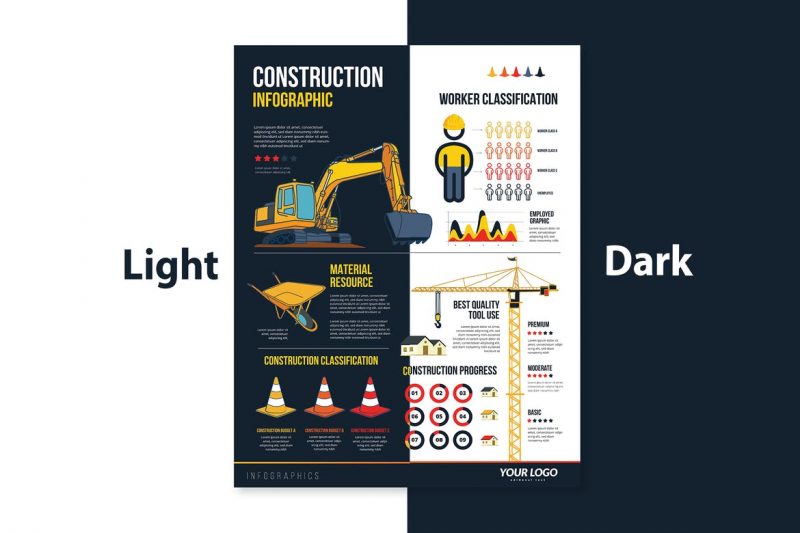
2. Theme-based background-color
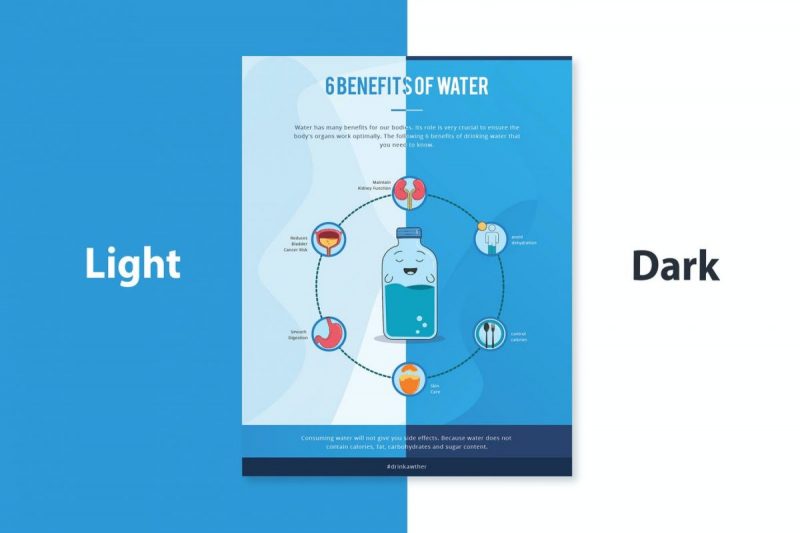
The second option is to use a theme-compatible background color. For instance, the infographic you are creating contains data about the benefits of water. In your infographic, you can use blue, which is often associated with water.
3. Creating infographics for Instagram
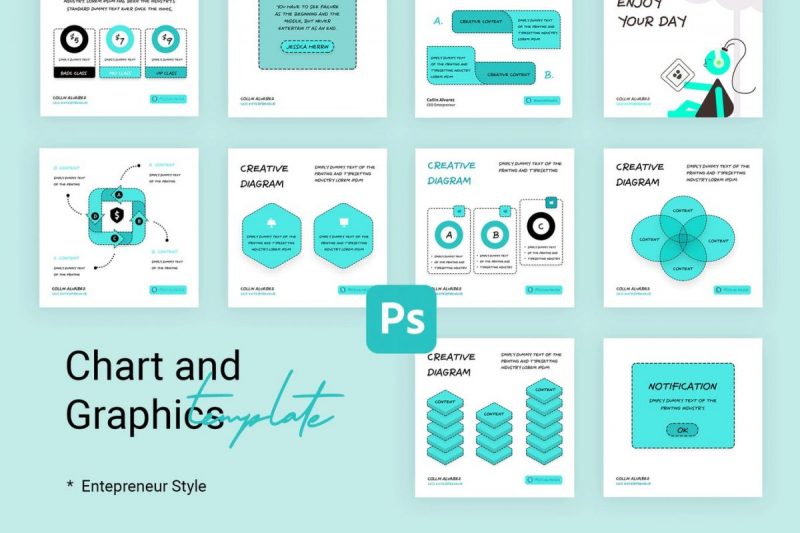
When creating an infographic for Instagram, make sure the image size looks right. Consider using a square size or the same pixels for the image size. For example, 1080×1080, 720×720, and so on.
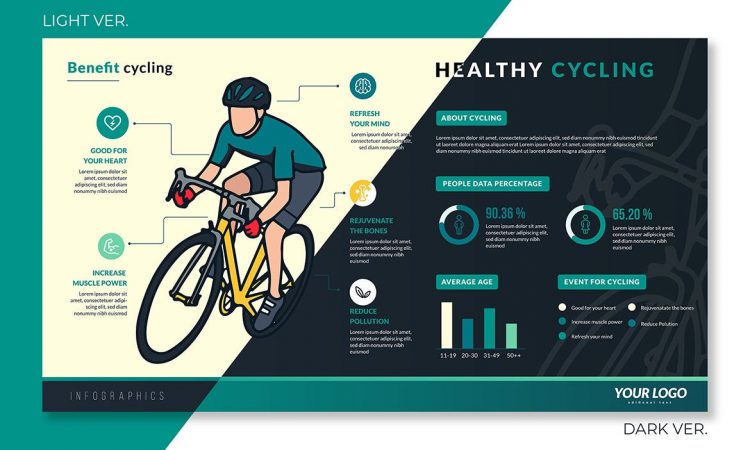
4. Use the landscape mode
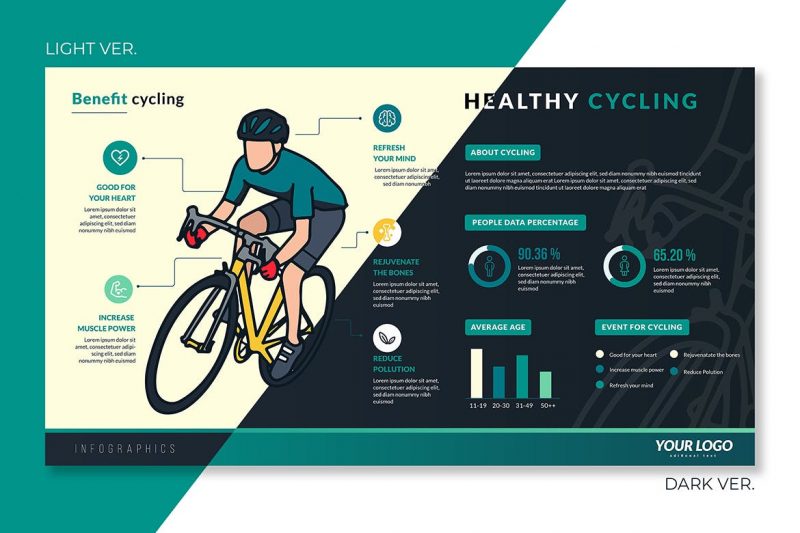
Additionally, infographics do not always have to be in portrait orientation. Instead, you can use landscape orientation, in which the width is greater than the length.
5. UI/UX Infographics
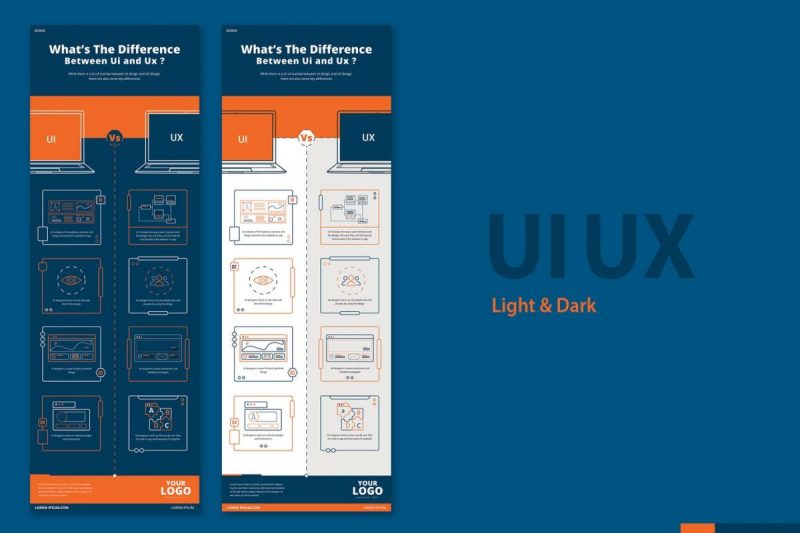
It might be a good idea to include infographics in your user interface if you want to.
Conclusion
These are some tips and infographic design options to help you create the best infographic possible. Making an infographic requires a lot of detail so that readers can easily understand what information you are conveying.